Young People’s Screen Habits
Infographic Design
About the Project
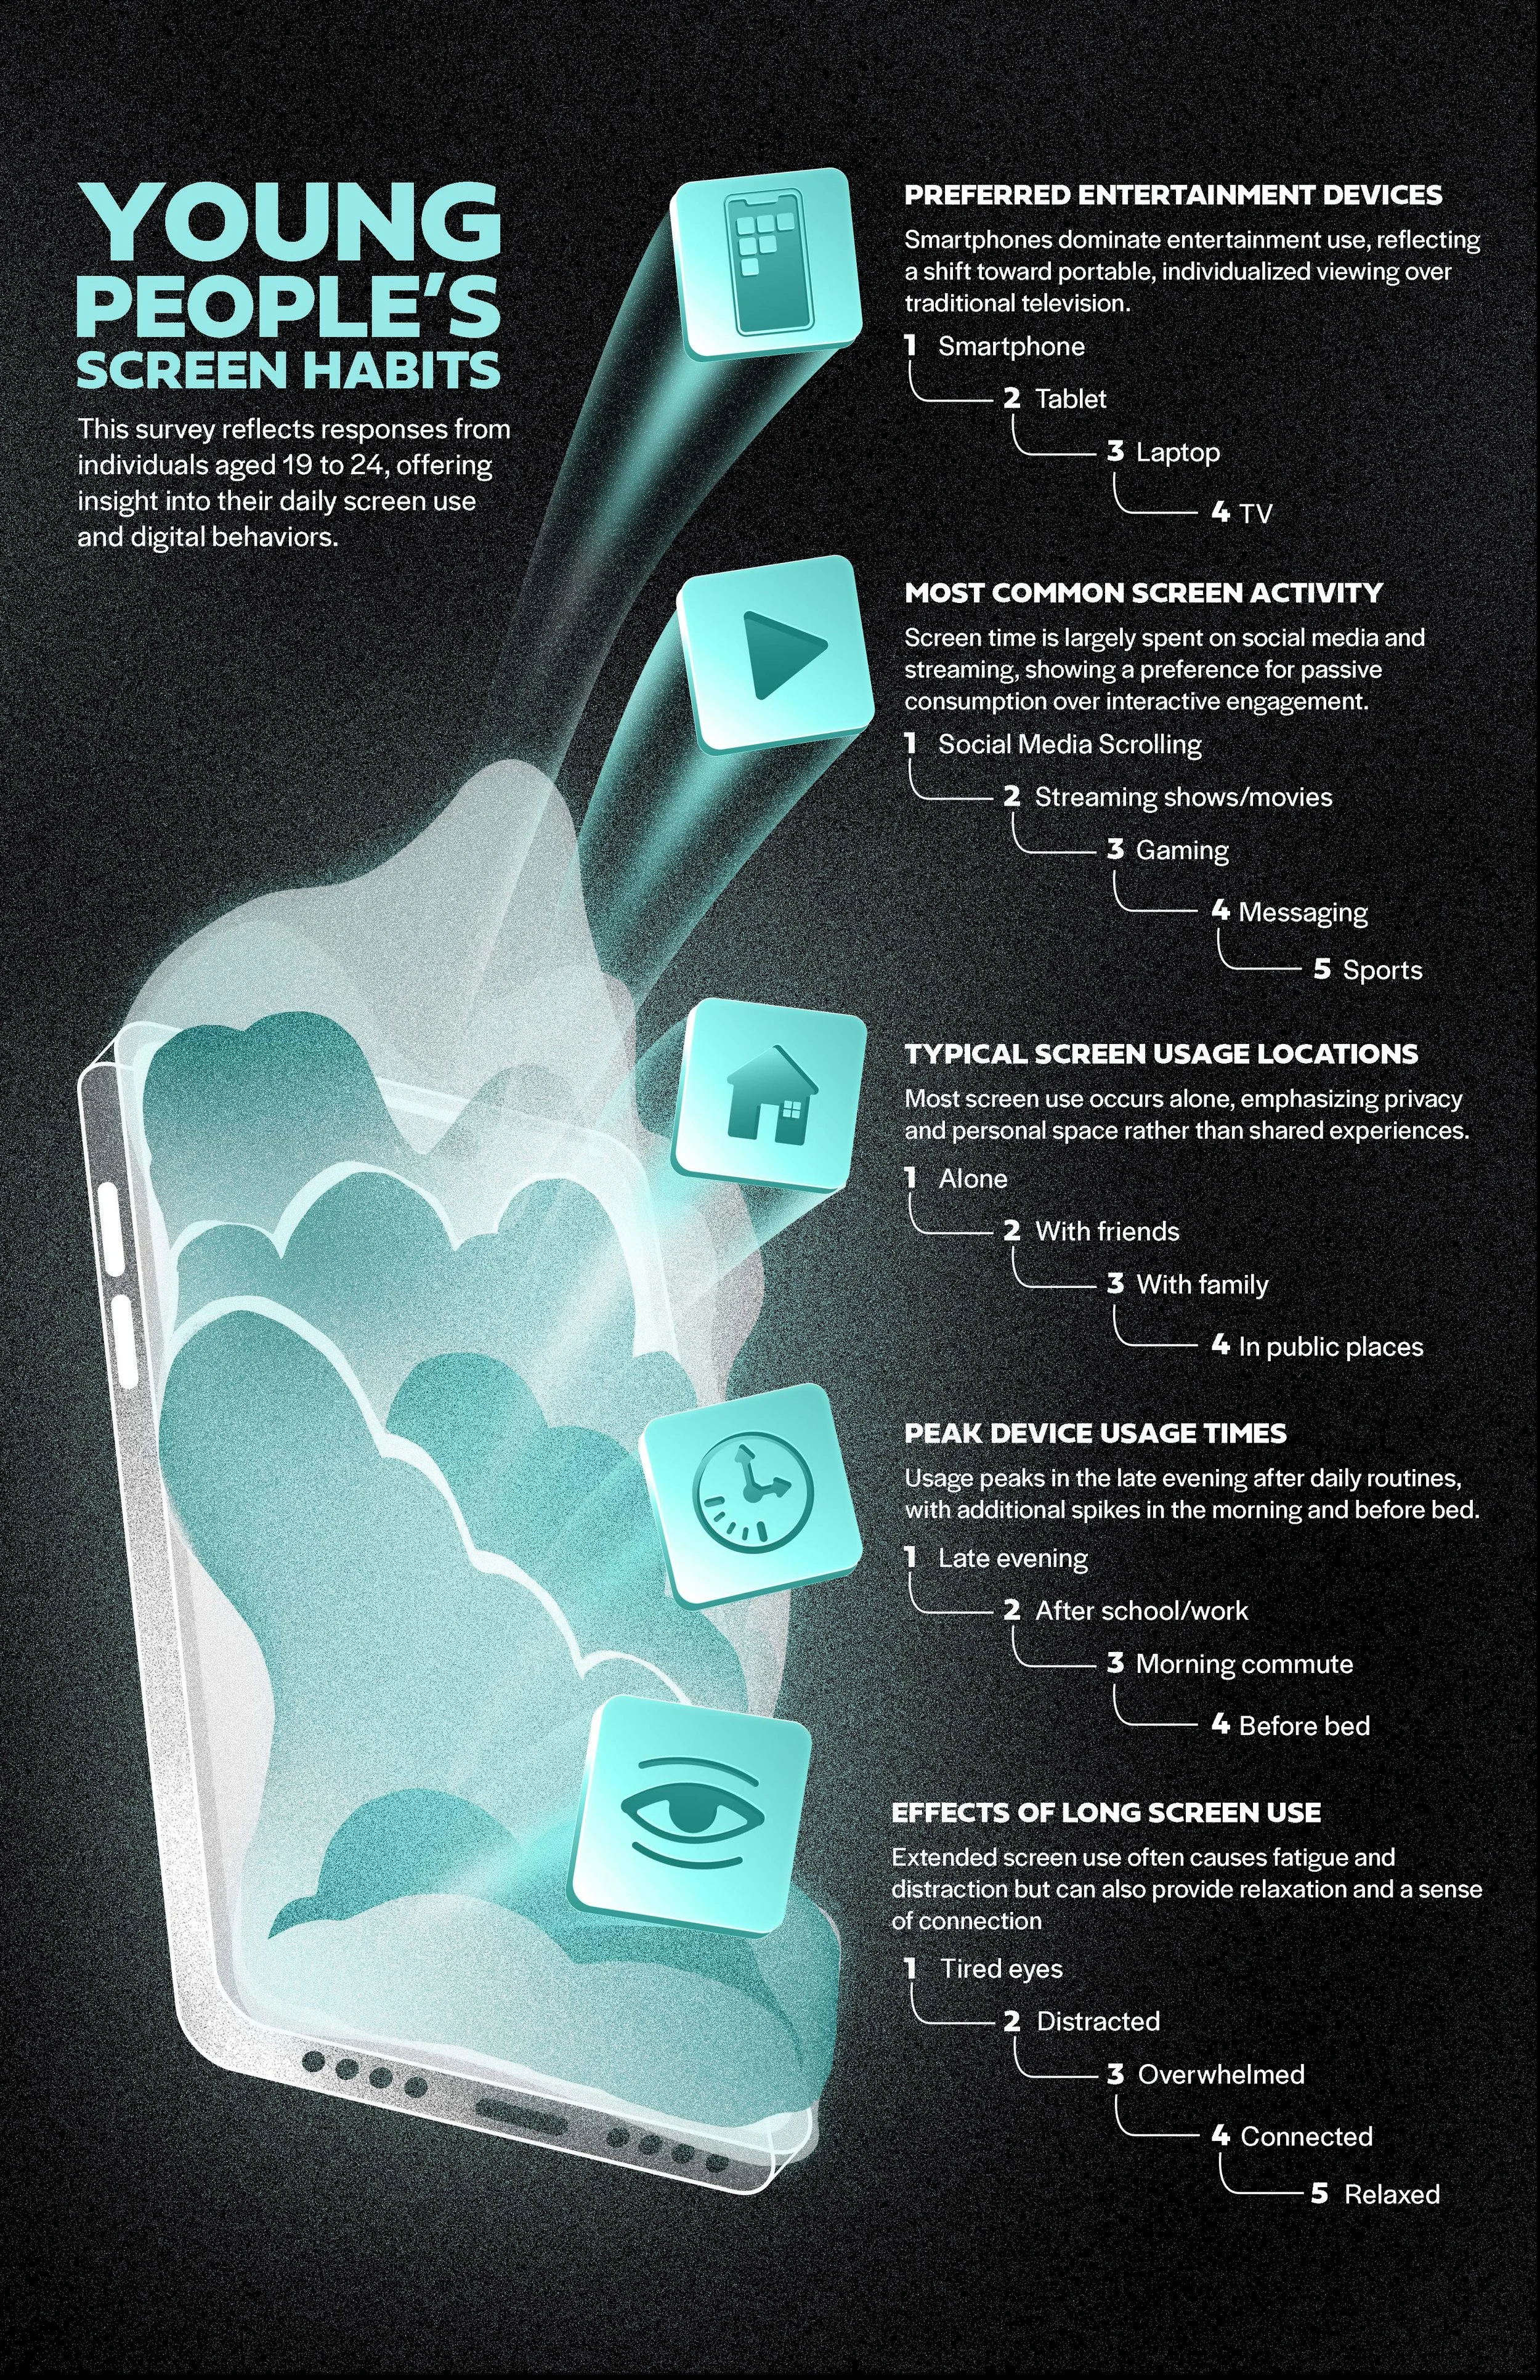
The client requests a single-page qualitative infographic that visually communicates fictional data about the screen habits of young people ages 16–24. The goal is to transform raw qualitative responses into a clear, compelling, and instantly understandable visual story.
Deliverables
A single-page infographic that visually represents the qualitative dataset through:
icons, illustrations, or symbolic imagery
clear narrative flow
effective visual hierarchy
layout that supports quick scanning and comprehension